Shopify Analytics: Understanding reports, dashboards & alternatives
Shopify’s built-in analytics tells you what sold. It doesn’t tell you much about why visitors didn’t buy, where they came from or how your store is performing as a website.
Most Shopify merchants end up needing at least one more analytics tool. The question is which one, and whether its privacy requirements, setup complexity and accuracy tradeoffs are worth it.
This post covers all three realistic options: Shopify Analytics (the built-in system), Google Analytics 4 and Plausible Analytics, a privacy-first alternative that works without cookies or consent banners.
- Shopify Analytics: the built-in reporting system
- Why merchants look for alternatives
- Google Analytics 4 for Shopify
- Plausible Analytics for Shopify
- Frequently asked questions
- Conclusion
Shopify Analytics: the built-in reporting system
The first option is the reporting system built into Shopify itself. It’s available right in your Shopify account, accessible from the admin sidebar under “Analytics.”
It gives merchants a quick overview of store performance. Reports cover sales, customer behavior, finances and more without any setup required.
Standard reporting is included with all pricing plans. According to Shopify’s pricing page, you get “access to 60+ reports to track your store performance or build custom reporting with flexible, real-time analytics.”
Shopify Analytics has three main components: an Overview dashboard, detailed reports and a live view.
Types of reporting in Shopify
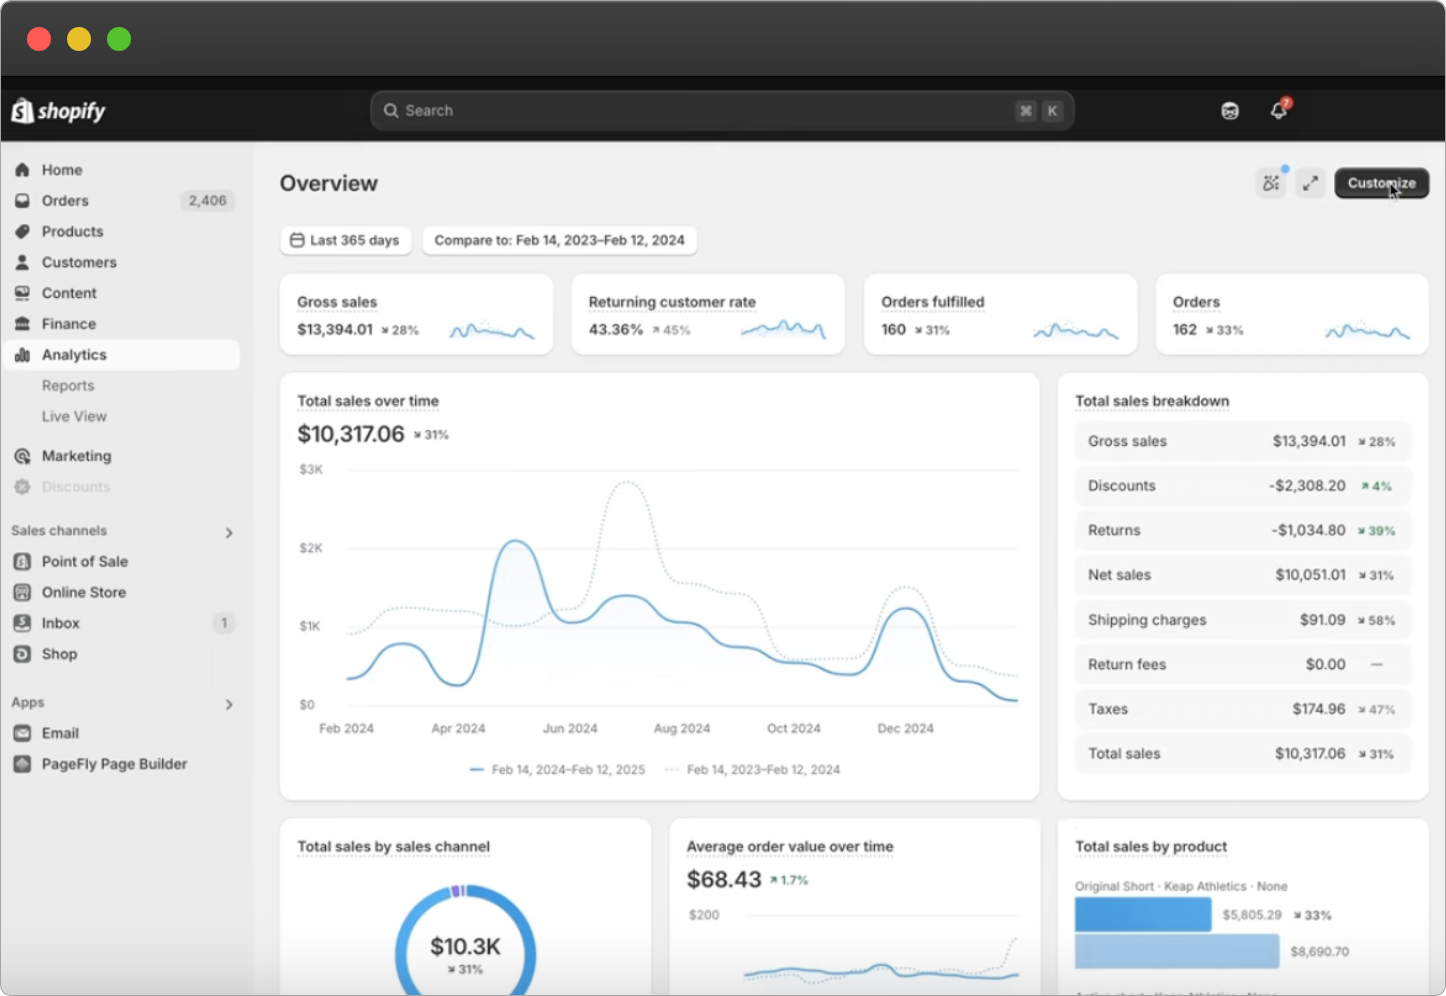
Overview dashboard
This is the first thing you see when you open Analytics. It shows your most important ecommerce metrics at a glance: sales, orders, conversion rate and more.
It’s a collection of data cards with summary numbers and trend graphs. You can customize which metrics appear on desktop, select date ranges, compare against previous periods and click any card to open the corresponding detailed report.

Reports
Shopify’s full reports library is accessible from the sidebar. Reports are divided into categories like Finances, Acquisition and Behavior. Each includes a graph and data table you can filter and segment.


The default report categories:
Acquisition reports: Sessions and visitors by source, location and referring site.
Behavior reports: How customers browse and shop your store.
Customers reports: Customer location, returning customers, one-time customers and cohort analysis.
Finance reports: Sales summary, taxes, gift cards, liabilities and store credit transactions.
Fraud reports: Chargeback rates and high-risk orders.
Inventory reports: Stock levels, inventory movements and product availability.
Marketing reports: Sessions and sales attributed to marketing activity.
Order reports: Order trends, fulfillment status and return rates.
Profit reports: Gross margins, cost of goods sold and net profit by product and channel.
Retail sales reports: In-person sales, staff contributions and product performance at retail locations.
Sales reports: Total sales, sales by product or channel and average order values.
Custom reporting and advanced filtering are available on higher Shopify plans. All stores have access to the core reports.
Live View
Live View shows what’s happening on your store right now: current visitor count, locations, active actions and any live sales or checkouts. Most useful during flash sales or product launches.
Key metrics in Shopify Analytics
Here are the metrics you’ll see most often across the Overview dashboard and reports.
Total Sales: Revenue earned in the selected period after all adjustments. In Shopify, Total Sales is net sales plus taxes, shipping and duties. It’s the bottom-line number.
Gross Sales: All items sold at full price, before discounts, returns or other deductions. Useful for understanding pre-discount demand.
Net Sales: Gross Sales minus discounts and returns. Excludes taxes and shipping fees.
Total Orders: Count of orders placed in the period, across all sales channels. Each order is counted once regardless of how many items are in it.
Online Store Sessions: The number of visits to your store. One person can generate multiple sessions by returning later, so sessions are always higher than unique visitors.
Conversion Rate: Orders divided by sessions, expressed as a percentage. The Overview dashboard also breaks this into a funnel showing cart adds, checkout starts and completed purchases, so you can see where customers drop off.
Average Order Value (AOV): Total revenue divided by total orders. If you had $1,000 from 20 orders, your AOV is $50.
Returning Customer Rate: Percentage of customers who have placed more than one order. A measure of loyalty and retention.
Return Rate: Percentage of items sold that were later returned.
Why merchants look for alternatives
Shopify Analytics is useful for a quick read on store activity. But it has real limitations that push most merchants toward additional tools.
Where Shopify Analytics falls short
Overly complex for everyday use
Shopify recently overhauled its Analytics UI and the reception was poor. The current community consensus is that it’s too complicated for most store owners. Dozens of reports spread across multiple categories, with jargon that doesn’t map to how most merchants think about their business.
Requires a cookie consent banner
Shopify’s tracking relies on cookies. That means you need visitor consent to collect data. When visitors decline, you lose that tracking entirely, including completed checkouts. Your conversion rate and traffic data will be understated as a result.
Ecommerce-only focus
Shopify Analytics is built around sales metrics: gross sales, order counts, return rates. It doesn’t cover the web analytics side. Bounce rate, time on page, scroll depth and a clear breakdown of which marketing channels are driving traffic are all absent. If you want to understand your site as a website rather than just a store, you need something else.
Cost scales with your plan
Advanced reporting is locked behind higher Shopify plans. If you downgrade or can’t justify the upgrade cost, you lose access to data you’ve been relying on.
Comparing your options
The gap Shopify Analytics leaves is roughly this: you need to understand your website traffic and marketing performance, not just your orders. That’s where external tools come in. The two main options are Google Analytics 4 and Plausible Analytics. They serve different audiences with very different tradeoffs.
| Shopify Analytics | Google Analytics 4 | Plausible Analytics | |
|---|---|---|---|
| Setup | Automatic | Complex | One script tag |
| Cookie consent required | Yes | Yes | No |
| Privacy | Moderate | Poor | Strong |
| Ad blocker impact | Low | High | Very low |
| Web analytics | Limited | Full | Full |
| Ecommerce tracking | Built-in | Manual setup | Manual setup |
| Real-time data | Live View only | No (up to 48h delay) | Yes |
| Data accuracy | Partial (cookie opt-outs) | Partial (blockers + opt-outs) | High |
| Open source | No | No | Yes |
Track Shopify traffic, purchases and revenue attribution without cookies or a consent banner
Google Analytics 4 for Shopify
Many Shopify merchants use GA4 alongside Shopify Analytics: Shopify for store performance and GA4 for deeper website and marketing analysis.
Note: GA4 requires a cookie consent banner and is complex to configure. It also has documented accuracy problems. Independent studies (example) have found significant discrepancies in traffic source attribution. If GA4’s complexity is your main frustration, skip to the Plausible section below.
What GA4 adds over Shopify Analytics
Deeper behavior analysis
GA4 lets you ask complex questions: how many visitors viewed a specific product, added it to cart but didn’t complete the purchase and where did they come from? Shopify can’t answer that without an Enterprise plan. GA4 can, through segments and explorations.
GA4 also tracks events beyond the purchase journey: video plays, link clicks, form submissions. This gives a fuller picture of how visitors engage with your store.
Customization
GA4 supports custom events, custom dimensions and custom reports. If you have unique interactions to track (a custom upsell flow, for example), GA4 can record them. Shopify’s reports are fixed.
Cross-domain and cross-platform tracking
If your business extends beyond your Shopify storefront, such as a separate blog, a web app or multiple domains, GA4 can unify tracking across all of them. Shopify Analytics only covers your Shopify store.
GA4 also tracks mobile app data, combining web and app analytics in one property if you have both.
Attribution and marketing analytics
GA4 integrates with Google Ads and Google Search Console, giving a more complete picture of marketing performance. You can track full attribution paths (first touch vs. last touch contributions), not just last click.
Raw data export
You can export all raw event data to BigQuery for custom analysis, SQL queries or combining with CRM and ad spend data. Shopify doesn’t offer raw data export from its analytics system.
How to set up Google Analytics 4 on Shopify
There are three methods.
With the Google & YouTube Channel app
The most straightforward option. Install the Google & YouTube Channel App through your Shopify admin under Online Store > Preferences. Connect your existing GA4 account or create a new one.
Note: checkout step tracking is not available with this method unless you’re on Shopify Plus.
Through Google Tag Manager or gtag.js
Google Tag Manager (GTM)
Create a GTM account and container. Add the GTM container code to your theme: the script in the <head> and the noscript tag immediately after the opening <body> tag of your theme.liquid file.
Inside GTM, add a GA4 configuration tag with your Measurement ID. This gives you granular control over event tracking including page views, add-to-cart actions and purchases. Test using GTM’s Preview mode and GA4’s DebugView before going live.
If you install GA4 via both the Shopify integration and GTM simultaneously without careful configuration, you can end up with double-counted data.
Global Site Tag (gtag.js)
Add the GA4 gtag.js snippet directly to the <head> section of your theme. To track purchases, add the conversion code to the “Additional Scripts” section in your Shopify checkout settings.
Gtag.js is simpler to start with but harder to manage and customize without editing code directly.
For a detailed walkthrough, see this full guide.
Third-party Shopify apps
Apps like Analyzify, AD Google Analytics 4 and others in the Shopify App Store can handle GA4 setup for you. Compare features and pricing to find one that fits your needs.
GA4 vs. Shopify Analytics
Setup
Shopify Analytics is automatic. GA4 requires deliberate setup: tracking code on all pages including checkout, correct event parameters and careful testing. Missteps lead to missing or duplicate data.
Data accuracy
GA4 relies on a JavaScript snippet running in the visitor’s browser. Ad blockers and privacy-focused browsers (Brave, DuckDuckGo) commonly block it entirely. Those visits and purchases are simply not recorded. Shopify Analytics captures orders server-side, so it’s less affected.
GA4 data also takes up to 48 hours to fully stabilize. Shopify’s reports update near real-time.
Privacy
Google Analytics has a well-documented history of cross-device and cross-app tracking, which has generated significant legal scrutiny across Europe. This forces consent banners onto your site, and banner refusals mean missing data.
Plausible Analytics for Shopify
Plausible is a privacy-first alternative to Google Analytics built around a different premise: you shouldn’t need to become a data engineer to understand how your website is performing.
No cookies. No personal data collection. No consent banners. One script tag and you have a complete analytics setup that works for your Shopify store.
Why Plausible is different
No cookie consent banner required
Plausible doesn’t use cookies or collect personal data, so you don’t need a consent banner. Every visitor who hits your store is counted, including those who would have rejected a cookie prompt on any other tool. Safari’s Intelligent Tracking Prevention (ITP) doesn’t affect Plausible at all.
Higher accuracy by default
Plausible is significantly less blocked by ad blockers than Google Analytics. For the small share of visitors who blanket-block all analytics regardless, you can serve the Plausible script as a first-party connection from your own domain.
We also automatically detect and exclude bot and spam traffic. This is something GA4 users have to configure and monitor manually.
One dashboard for everything
GA4 splits your data across multiple reports, explorations and views. Plausible puts everything in one dashboard: visitors, traffic sources, top pages, conversions, revenue, devices and locations. You can see the full picture without navigating between reports.
Real-time data
Plausible updates continuously. GA4 can take up to 48 hours to stabilize. Shopify’s standard reports update every few minutes to an hour (only Live View is real-time).
GDPR-compliant without configuration
Because Plausible doesn’t collect personal data, it’s GDPR-compliant by design. No data processing agreements to manage, no legal exposure from mishandled personal data and no consent configuration to maintain.
Open source
Plausible’s code is publicly available on GitHub. You can inspect exactly what it tracks and how. Shopify Analytics and GA4 are both black boxes.
How to set up Plausible on Shopify
Step 1: Add the tracking script
- In your Shopify admin, go to Sales Channels > Online Store > Themes
- Click “…” next to your active theme and select “Edit code”
- Open the
theme.liquidfile - Paste your Plausible snippet just before the closing
</head>tag - Save and confirm data is appearing in your Plausible dashboard
Your snippet looks like this:
<script defer data-domain="yourdomain.com" src="https://plausible.io/js/script.js"></script>
Step 2: Add ecommerce tracking (optional)
To track checkout events and revenue in Plausible, follow the Shopify integration guide. This covers setting up purchase goals, revenue tracking and connecting checkout events so your Plausible dashboard reflects sales alongside traffic.
Once configured, you’ll see conversion data and revenue inside the same dashboard as your standard traffic metrics.
Using Plausible with Shopify
Web analytics Shopify doesn’t provide
Your Plausible dashboard shows visitors, sessions, bounce rate, time on page, scroll depth, top pages, referral sources, countries, devices and browsers. This is the website performance layer that Shopify Analytics doesn’t give you.
Useful additions:
Google Search Console integration: See which keywords bring organic traffic to your store, directly inside Plausible.
UTM tracking: Tag your paid and email campaign links with UTM parameters to track marketing performance inside Plausible. gclid from Google Ads is also parsed automatically.
Cross-domain tracking: If you run a blog or content site separately from your Shopify store, Plausible can track both in one dashboard. Shopify Analytics won’t touch anything outside your store.
Shared dashboards: Generate public or password-protected links to share your Plausible dashboard with a marketing team, agency or client. You can also embed it anywhere.
Ecommerce tracking
Beyond standard web metrics, Plausible supports goals, conversion funnels and revenue tracking. See the complete ecommerce revenue attribution guide for how to set this up end to end.
Once configured, you can filter your dashboard by a revenue goal and immediately see which sources, campaigns, pages and devices contributed to those conversions.
Here’s a concrete example. Say you sell hoodies and beanies and want to know which marketing activities drive hoodie purchases. Set up a “Purchase” goal marked as a revenue goal, add custom properties for product category and configure supporting goals for “Add to Cart” and “Begin Checkout.”
![]()
With this in place, filtering by the “complete purchase” goal and the “hoodies” product category shows every traffic source, campaign and page associated with those purchases. Toggle between UTM sources, mediums and campaigns to assess channel effectiveness. Toggle between top, entry and exit pages to find your best-performing content.
One practical advantage: because Plausible sits outside Shopify, your analytics stay consistent if you ever switch ecommerce platforms. The data and setup don’t change.
Frequently asked questions
Does Shopify have built-in analytics?
Yes. Shopify includes a built-in reporting system with an overview dashboard, 60+ reports and a live view. It’s available on all pricing plans with no setup required. The tradeoff is that it relies on cookies, requires a consent banner and only covers your Shopify store (not your wider web presence).
Do I need Google Analytics for my Shopify store?
Not necessarily. GA4 adds deeper behavior analysis and cross-domain tracking, but it requires complex setup, a cookie consent banner and comes with known accuracy issues from ad blocker blocking. Many merchants switch to Plausible instead: simpler to configure, more accurate because it doesn’t depend on cookie consent and no compliance overhead.
Is Shopify Analytics accurate?
Partially. Because Shopify’s tracking relies on cookies, any visitor who declines your consent banner isn’t tracked. That includes completed checkouts, which means your conversion rate data will be lower than reality. Tools like Plausible that don’t use cookies can count more of your actual visitors.
Can I use Plausible Analytics with Shopify?
Yes. Add the Plausible script to your theme.liquid file and you have full web analytics running immediately. For ecommerce tracking (add to cart, checkout, purchases and revenue), Plausible provides a Shopify integration guide using a custom pixel in Shopify’s Customer Events system.
Can I replace Google Analytics with Plausible on Shopify?
For most Shopify merchants, yes. Plausible covers traffic sources, top pages, conversions, revenue and goal funnels in one dashboard without cookies or consent banners. The main case for keeping GA4 is if you need BigQuery data export or tightly integrated Google Ads attribution.
Does Plausible track ecommerce events on Shopify?
Yes. You can track add to cart, checkout started, payment info added and completed purchases, all with revenue attribution. Custom properties let you break down sales by product title, category or any other dimension you define.
Conclusion
Shopify Analytics covers the basics for store owners who need a quick read on sales performance. GA4 goes deeper but at the cost of setup complexity, accuracy gaps and ongoing privacy compliance overhead.
Plausible replaces GA4 entirely for most Shopify merchants. Simpler to set up, more accurate because it doesn’t depend on cookie consent and a single dashboard you can use without a guide.
The honest tradeoff: if you need BigQuery data export or Google Ads attribution within one platform, GA4 still has the edge. For everything else, Plausible gives you better data with less effort.
Try Plausible free for 30 days or go straight to the Shopify integration guide to set up ecommerce tracking.